
Today, Streetlytics is used by governments to build safer roads and by insurance companies to create more robust pricing models and acquire new customers. This blog explains how governments and insurance companies are using Streetlytics to reduce risk and increase safety.
Low-mileage discount
Vehicles that spend less time on the road have a lower risk of being involved in an accident. Citilabs works with insurers to identify neighborhoods with low average Vehicle Miles Traveled (VMT). VMT is calculated to understand the average daily distance traveled, as well as the weekday and weekend VMT. Understanding the driving habits of a neighborhood helps insurers more accurately price a current customer and market to new ones.

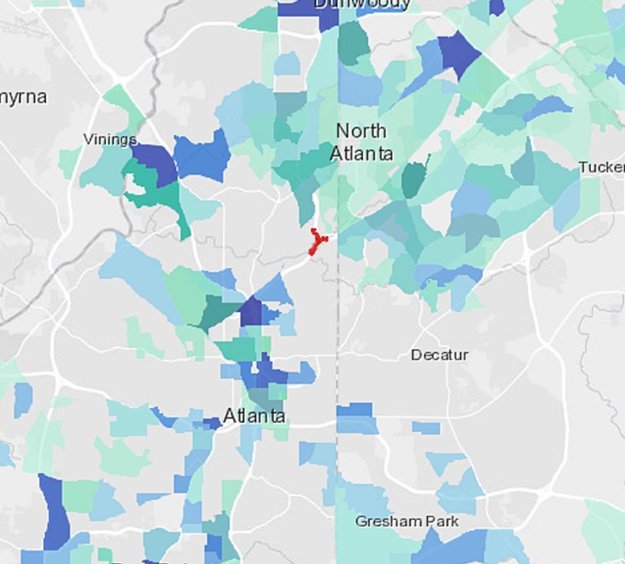
Neighborhoods whose total daily distance averages under 15 miles/day
Traffic Accident Exposure
A range of factors influence risk of traffic accidents. Until recently, these factors have been limited to information about the drivers involved in a collision and the permanent attributes of the road like lighting, signage, and lane marking. Today, Streetlytics helps governments and insurers understand the other people using the road when a crash happens.
Streetlytics understands the hourly average directional movement on every block of US road. This includes:
Number of vehicles on the road (and turning)
Number of pedestrians
Driver and pedestrian home locations
Driver and pedestrian demographics
Vehicle occupancy
Vehicle speed
How long each vehicle has been traveling
How much further each vehicle is going
Trip purpose
How often drivers and pedestrians pass by this location

Potential Risk
The other people using the road can influence the risk of traffic accidents. Streetlytics helps governments and insurers to identify other potentially risky locations.

High risk locations
Neighborhood Risk
Not all trips are equally safe. Streetlytics understands the average turn by turn path of every vehicular trip on US roads. Governments and insurers can identify neighborhoods with high risk trips by combining a neighborhood’s vehicular paths with a map of high-risk locations. This combination creates an understanding of the risk level for traffic accidents for any household in America.
Neighborhoods that use a risky segment of road

Neighborhoods risk level
Location Health Risk
People who spend significant amounts of time near high volume roads are at risk for multiple health conditions due to poor air quality. Streetlytics helps governments and insurers understand locations with potentially poor air quality due to high traffic volumes.

Road volumes by hour
Location Safety Risk
Roads with a high percentage of people who do not live nearby see decreased safety. Streetlytics helps insurers understand how many people on the road in front of a specific location are cutting through rather than living in that neighborhood. This information can help the insurer understand the property damage risk due to vehicles from the road.

Percent of cut through traffic
Change over time
Mobility will see significant changes over the next few years. These changes must be measured to be understood. Streetlytics measures the average week of movement every month. Comparing monthly measurements can show the changes in seasonality and the gradual change over time.

Change of volume over time
Environmental exposure for automobile crashes is vital to understanding who is on the road around every incident.