
Types of Location Data
At Hugecity, we initially tried to start a ‘things to do’ company based on where people were right now using cellular location. In 2010, cellular location data proved to be prohibitively expensive for our free social media startup so we were pivoted. Today, is a completely different story. The internet of things has created a deluge of location data exhaust. Many of these companies believe they can create new revenue streams by selling their data while other companies aggregate multiple sources together for resale. The number of companies selling location data combined with an uneducated market has created a race to the bottom price.
Types of Location Data
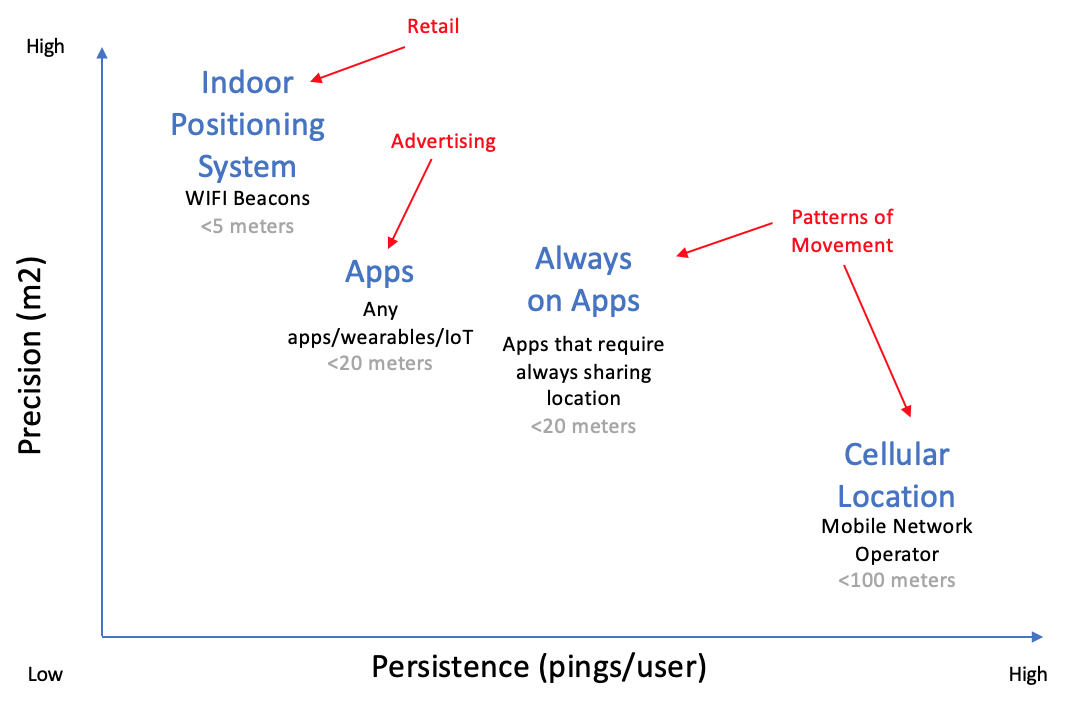
This chart details the four major sources of consumer level location data – apps, always on apps, cellular location, and indoor positioning systems. All four vary in terms of precision (ranging from 5 meters to 100 meters) and persistence (pings per user). Precision is good for confirming that a person is in a specific place while persistence is good for understanding patterns of movement.
Indoor positioning systems are primarily used in retail to understand how people move within an enclosed environment. These WiFi/beacon systems are used by most large retail companies to capture the movement of everyone who walk through the door.
Mobile phone applications share a user’s location with digital advertising markets to allow companies to better target advertisements to an app’s users while they are in specific locations. A user’s location is shared with these markets only while the user is using that specific app. Most downloaded apps are rarely used which makes it difficult for an app to share multiple locations from a specific user. This limits the use most location data from apps to targeted advertising.
A select few mobile phone applications are only useful if users constantly share their location. These always on apps cover a variety of categories like safety, lifestyle, dating, travel, e-commerce, navigation, and weather. Multiple pings per user per day are capable of showing a user’s pattern of movement. When this data is aggregated and anonymized with other always on apps it is possible to understand population patterns of movement. Always on apps have both precision and persistence but limited sample size compared with the other technologies.
Similarly, cellular location data is also good to understand population movement. Cellular location data comes from mobile carriers with millions of users by constantly triangulating their users’ location between cell towers. What cellular location lacks in precision it makes up in sample size. Cellular location data cannot understand which specific stores are most visited, but it is precise enough to understand how neighborhoods move.
Location intelligence is the process of using location data to derive meaningful insight to solve a particular problem. It is possible to layer the location data on a map to identify relationships between different sets of geospatial data. For example, retailers combine their transactional data with their indoor positioning data to understand the how many people enter each store, what they buy, where they live, and their demographics.
This understanding is limited to the entrance of the store. To help retailers go beyond indoor positioning systems, some location data providers derive insights and analytics from their sampled movement outside of a location.
Unfortunately, only studying a single technology sample leaves the sample prone to bias. Sampling bias occurs when a sample is collected in such a way that some members of the intended population are less likely to be included than others.
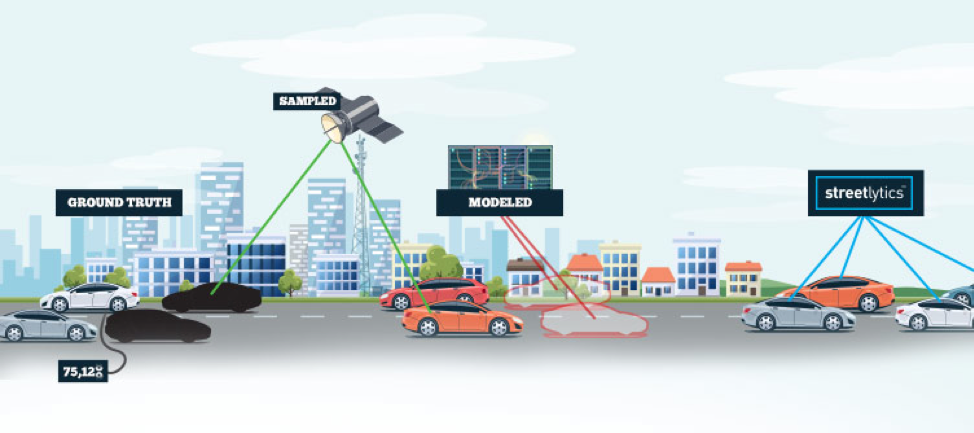
Understanding total population movement is possible using movement data from related but different sources. Citilabs’ Streetlytics uses a combination of phone movement data, traffic counts and travel demand modeling used in 2,500 cities around the world. The millions of observations from all three of these complementary data sources are input into a complex mathematical process to create the most complete, accurate and consistent national mobility data set ever created. This combination allows Streetlytics to confidently measure the average total population movement on all US roads every month.
It is necessary to match the best location intelligence to its specific use case. If the intended use is understanding movements within a specific store, indoor positioning systems are best. If the intended use is advertising to people who are in a specific store, general app location data is best. If the intended use is understanding the changes in mobility, urban development, out of home advertising, auto risk or anything else with the total population, then Streetlytics is the best.
Citilabs
Citilabs has built the world’s leading transportation modeling and simulation software, Cube, used in 2,500 cities around the world. In 2017, Citilabs combined its understanding of transportation simulation with mobile phone data and traffic counts to create Streetlytics. Streetlytics is the measurement of hourly vehicle and pedestrian volumes, speeds and demographics on every segment of road in the US. Streetlytics also includes the origin destination pairs for every vehicular trip and the turn by turn path in-between. Since 2017, Streetlytics has become the data that powers audience location measurement for Geopath, the nonprofit auditing organization for the US out-of-home media industry.
The $8B American billboard industry relies on understanding the total audience exposed to each of their billboards. This is a specific need which requires a specific type of location data. Location data on the movement of people can be gathered using four different technologies. Data from each of these technologies is aggregated and anonymized to protect the public’s privacy.