Atlanta’s kids don’t have a safe way to bike to school, so two neighborhood groups are teaming up to use tactical urbanism to add protected bicycle infrastructure along Virginia Ave to bring a decade old plan to life.

Atlanta’s kids don’t have a safe way to bike to school, so two neighborhood groups are teaming up to use tactical urbanism to add protected bicycle infrastructure along Virginia Ave to bring a decade old plan to life.
For the past 5 months, the Midtown Neighbors’ Association worked with ATLDOT’s Tactical Urbanism team to design, permit and install a project to increase safety for pedestrians crossing Monroe Dr at Greenwood Ave. This temporary project uses $1,000 worth of Home Depot paint and flex posts to extend the curb and create a pedestrian haven in the middle of the road. Pedestrians’ exposure to cars decreased by 50% (22 feet) while demonstrating to the city and the community the potential of long-term change for this crossing.
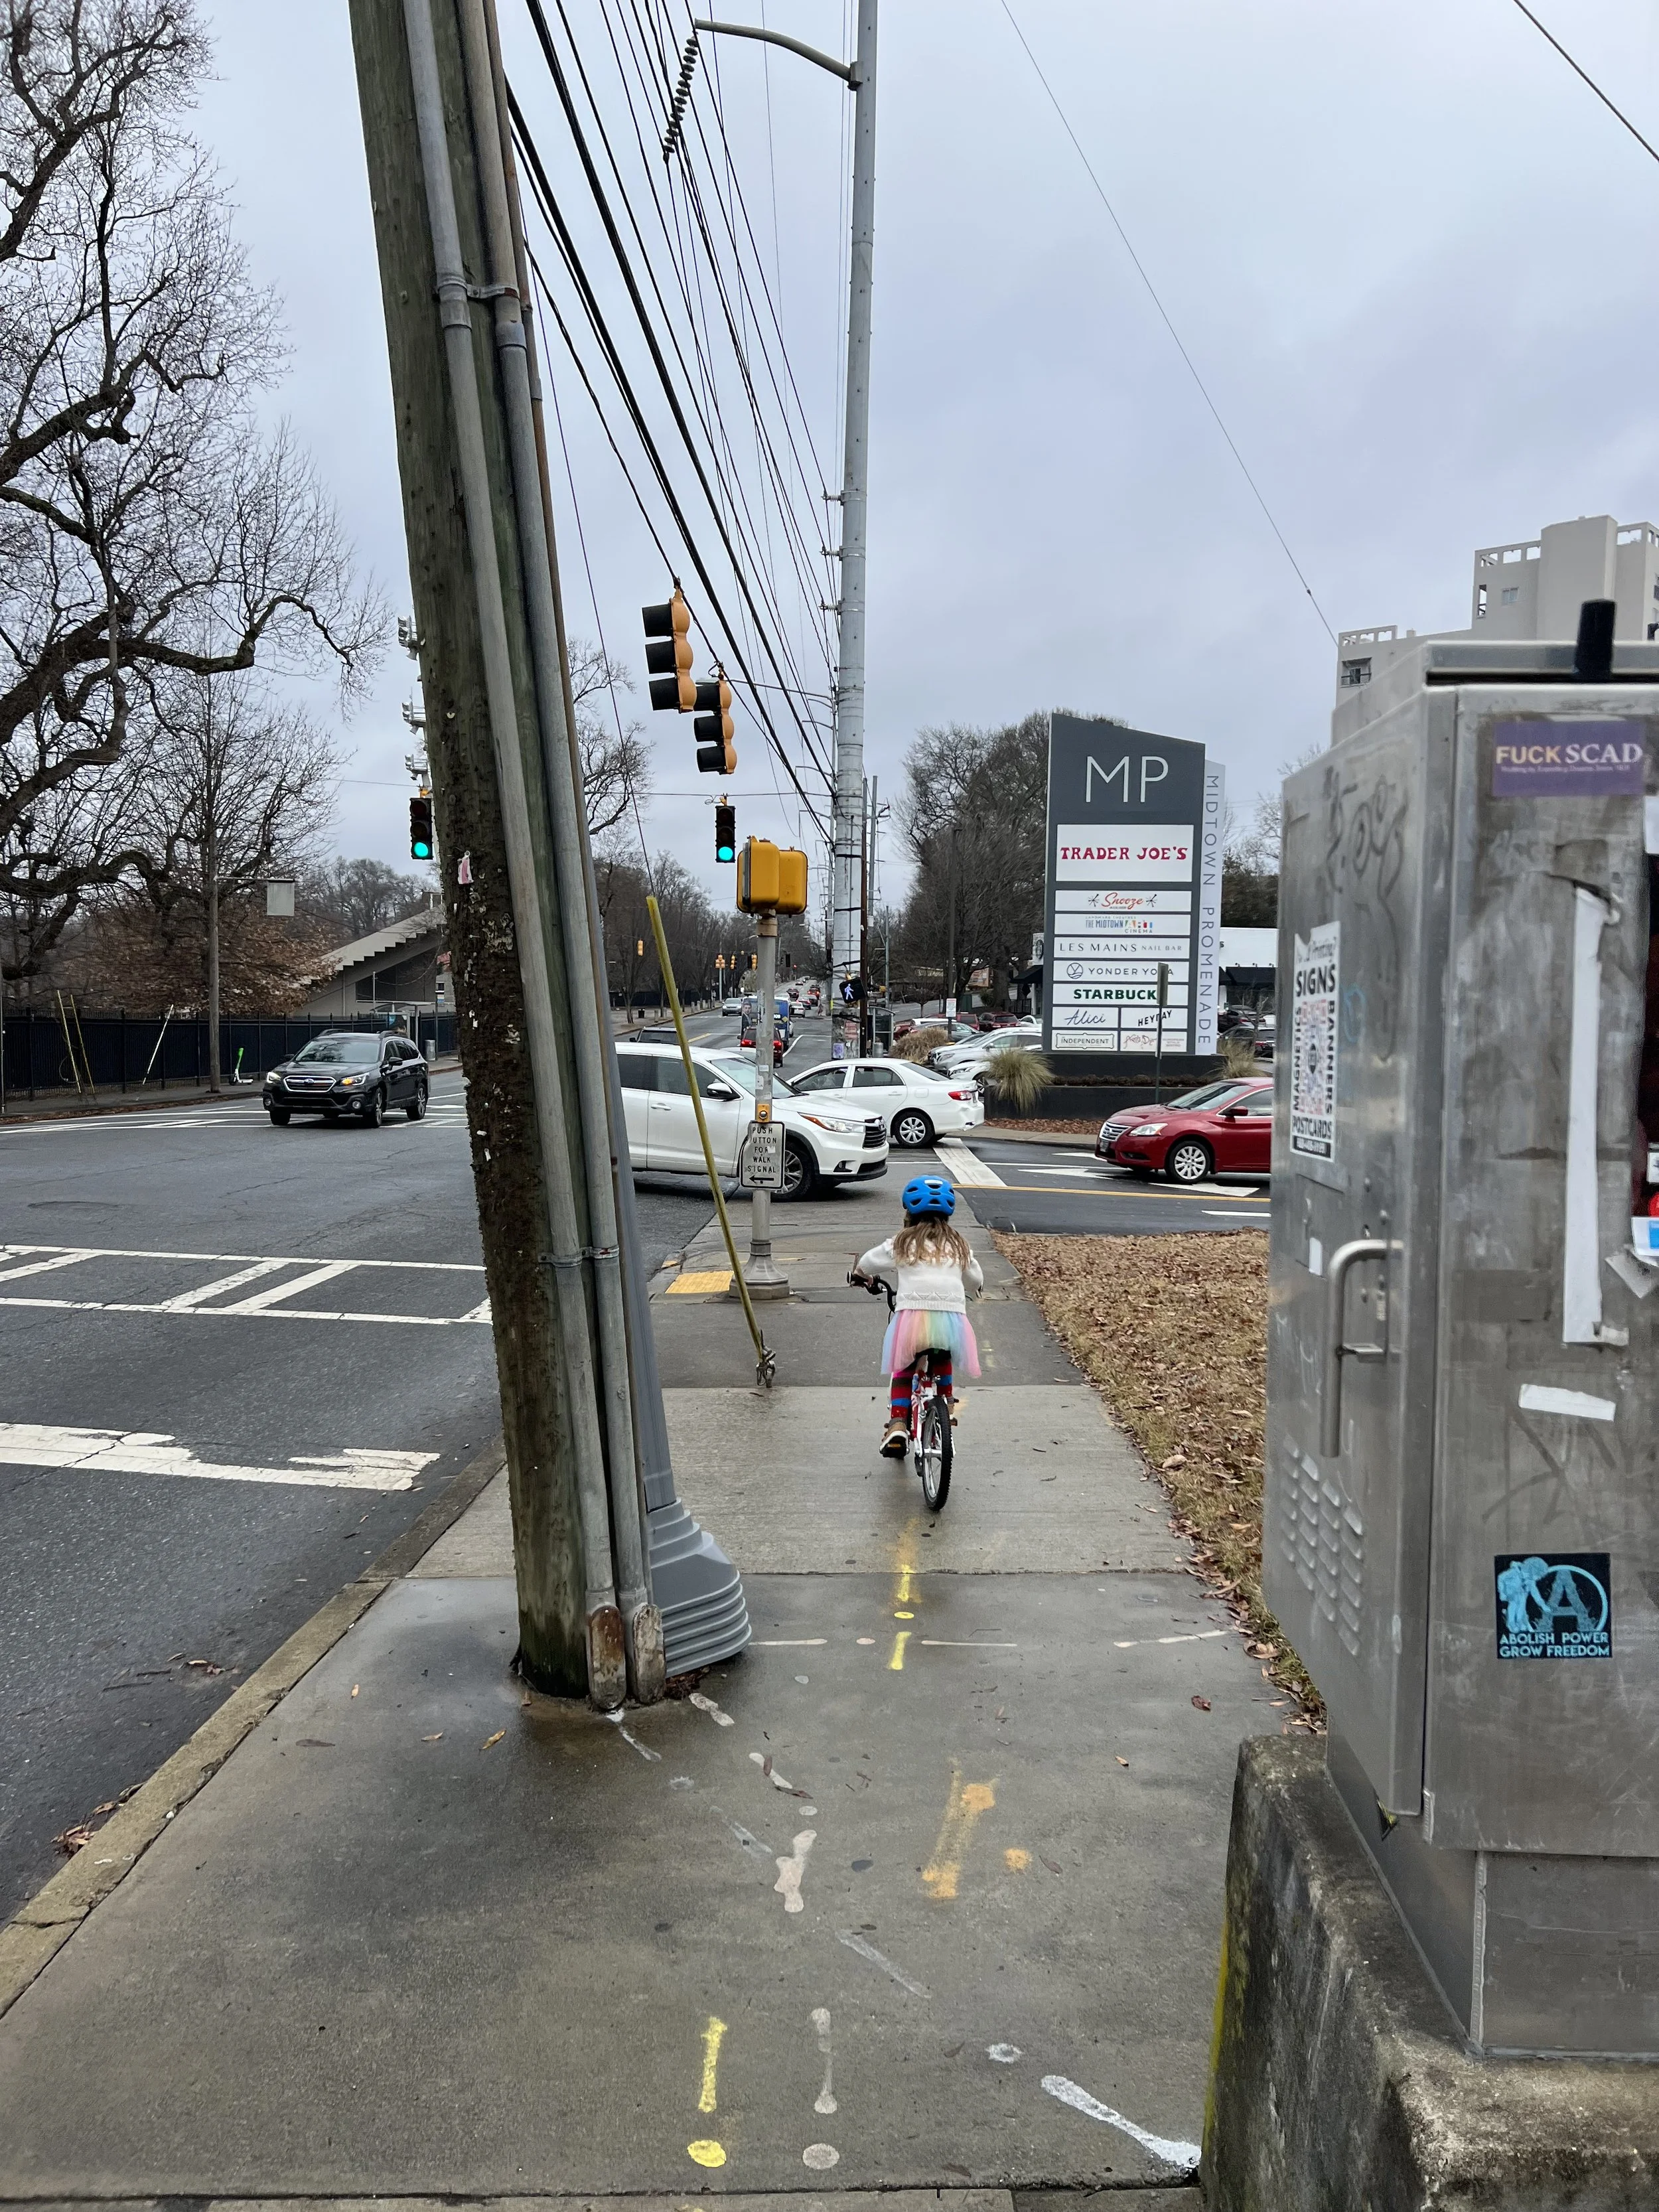
BIKING to school is essential for creating strong, healthy, independent children. The best biking routes to school minimize or remove our children’s exposure to cars, making the BeltLine the best path to school for many neighborhoods around Atlanta.
Unfortunately, most of Virginia-Highland Elementary’s 5 to 11-year-olds and the new school do not have safe access to the BeltLine. That’s despite the BeltLine passing less than a block from the facility.
Having the safest biking infrastructure in the world is useless if our most vulnerable cannot access it.
You can self monitor a wired home security system and avoid spending a bunch of money on a monitored system while using the existing infrastructure.
When will the City of Atlanta enforce speed limits for all vehicles using geofences?
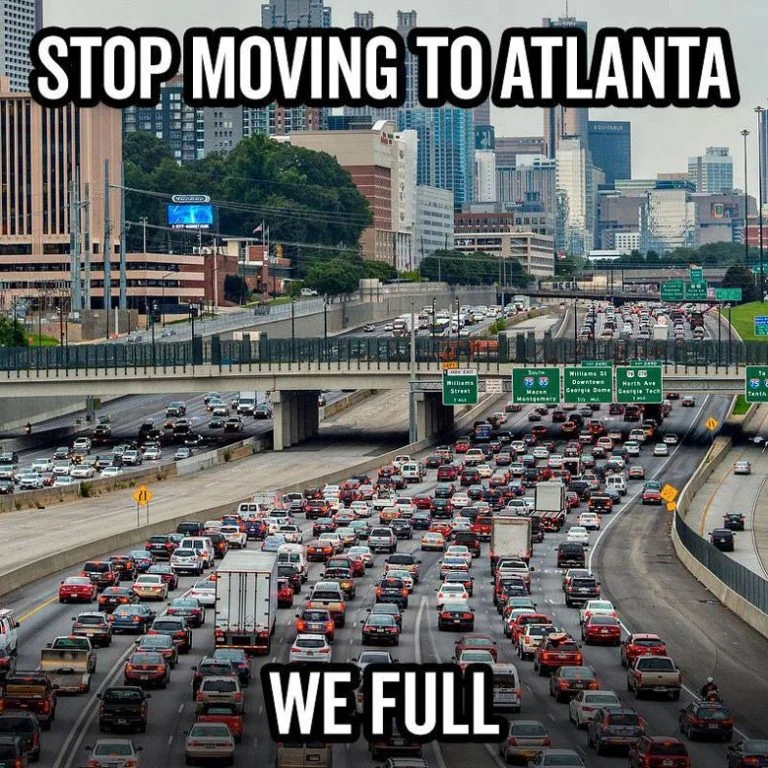
Atlanta is headed for a future of congestion, deadly roads, and inequality. How did we get here?
Atlanta is headed for a future of congestion, deadly roads, and inequality. This is what we can do to avoid it.
MARTA is a radial grid that focuses all of its movement to an empty downtown and lacks the vital circle lines that allow people to get to the activity centers spread around the city. To the vast majority of City of Atlanta residents, MARTA is only useful if you work downtown and the occasional event or jury summons. With More MARTA’s current prioritization, MARTA will continue to offer no relief to Atlanta’s overloaded roads as the city’s population grows by 140% in the next 20 years.
Scooters have the ability to significantly change the way we move around our cities but we will need to cross the chasm of adoption first. Segway-Ninebot (Xiaomi) has the ability to push micromobility over the chasm of adoption sooner than later
Today, Streetlytics is used by governments to build safer roads and by insurance companies to create more robust pricing models and acquire new customers. This blog explains how governments and insurance companies are using Streetlytics to reduce risk and increase safety.
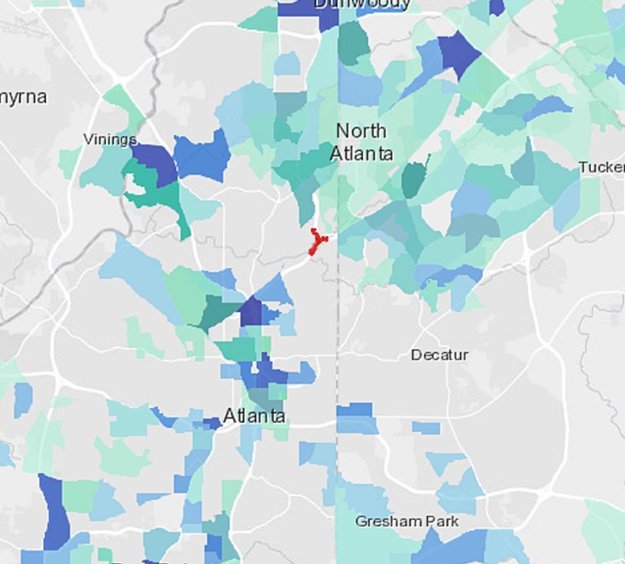
Vehicles that spend less time on the road have a lower risk of being involved in an accident. Citilabs works with insurers to identify neighborhoods with low average Vehicle Miles Traveled (VMT). VMT is calculated to understand the average daily distance traveled, as well as the weekday and weekend VMT. Understanding the driving habits of a neighborhood helps insurers more accurately price a current customer and market to new ones.

Neighborhoods whose total daily distance averages under 15 miles/day
A range of factors influence risk of traffic accidents. Until recently, these factors have been limited to information about the drivers involved in a collision and the permanent attributes of the road like lighting, signage, and lane marking. Today, Streetlytics helps governments and insurers understand the other people using the road when a crash happens.
Streetlytics understands the hourly average directional movement on every block of US road. This includes:
Number of vehicles on the road (and turning)
Number of pedestrians
Driver and pedestrian home locations
Driver and pedestrian demographics
Vehicle occupancy
Vehicle speed
How long each vehicle has been traveling
How much further each vehicle is going
Trip purpose
How often drivers and pedestrians pass by this location

The other people using the road can influence the risk of traffic accidents. Streetlytics helps governments and insurers to identify other potentially risky locations.

High risk locations
Not all trips are equally safe. Streetlytics understands the average turn by turn path of every vehicular trip on US roads. Governments and insurers can identify neighborhoods with high risk trips by combining a neighborhood’s vehicular paths with a map of high-risk locations. This combination creates an understanding of the risk level for traffic accidents for any household in America.
Neighborhoods that use a risky segment of road

Neighborhoods risk level
People who spend significant amounts of time near high volume roads are at risk for multiple health conditions due to poor air quality. Streetlytics helps governments and insurers understand locations with potentially poor air quality due to high traffic volumes.

Road volumes by hour
Roads with a high percentage of people who do not live nearby see decreased safety. Streetlytics helps insurers understand how many people on the road in front of a specific location are cutting through rather than living in that neighborhood. This information can help the insurer understand the property damage risk due to vehicles from the road.

Percent of cut through traffic
Mobility will see significant changes over the next few years. These changes must be measured to be understood. Streetlytics measures the average week of movement every month. Comparing monthly measurements can show the changes in seasonality and the gradual change over time.

Change of volume over time
Environmental exposure for automobile crashes is vital to understanding who is on the road around every incident.
LEVs provide a solution to a limited transportation system. 2019 will be the beginning of a wave of new LEV manufactures and forms that will last for years to come. Location will be extremely important for which LEV forms become popular, how they are used and how they develop. The rise of LEV use will lead to an unbundling of the use of the personal automobile followed by a change in transportation infrastructure. Just like mobile phones, there is an opportunity for multiple winners over the next few years.
At Hugecity, we initially tried to start a ‘things to do’ company based on where people were right now using cellular location. In 2010, cellular location data proved to be prohibitively expensive for our free social media startup so we were pivoted. Today, is a completely different story. The internet of things has created a deluge of location data exhaust. Many of these companies believe they can create new revenue streams by selling their data while other companies aggregate multiple sources together for resale. The number of companies selling location data combined with an uneducated market has created a race to the bottom price.
Types of Location Data
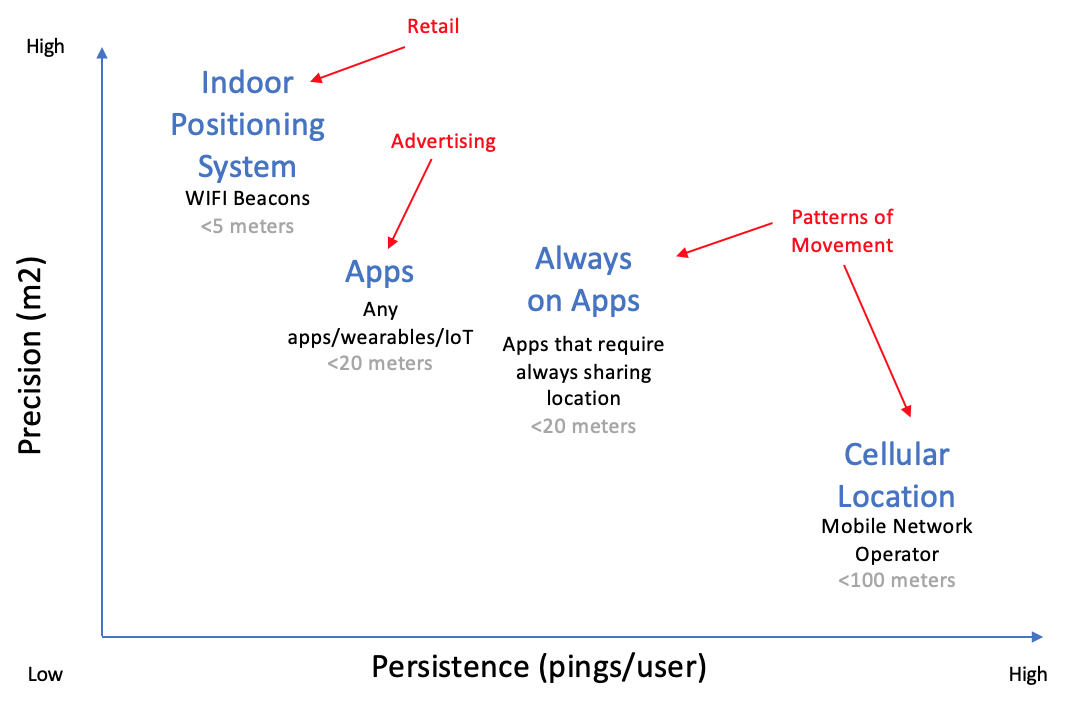
This chart details the four major sources of consumer level location data – apps, always on apps, cellular location, and indoor positioning systems. All four vary in terms of precision (ranging from 5 meters to 100 meters) and persistence (pings per user). Precision is good for confirming that a person is in a specific place while persistence is good for understanding patterns of movement.
Indoor positioning systems are primarily used in retail to understand how people move within an enclosed environment. These WiFi/beacon systems are used by most large retail companies to capture the movement of everyone who walk through the door.
Mobile phone applications share a user’s location with digital advertising markets to allow companies to better target advertisements to an app’s users while they are in specific locations. A user’s location is shared with these markets only while the user is using that specific app. Most downloaded apps are rarely used which makes it difficult for an app to share multiple locations from a specific user. This limits the use most location data from apps to targeted advertising.
A select few mobile phone applications are only useful if users constantly share their location. These always on apps cover a variety of categories like safety, lifestyle, dating, travel, e-commerce, navigation, and weather. Multiple pings per user per day are capable of showing a user’s pattern of movement. When this data is aggregated and anonymized with other always on apps it is possible to understand population patterns of movement. Always on apps have both precision and persistence but limited sample size compared with the other technologies.
Similarly, cellular location data is also good to understand population movement. Cellular location data comes from mobile carriers with millions of users by constantly triangulating their users’ location between cell towers. What cellular location lacks in precision it makes up in sample size. Cellular location data cannot understand which specific stores are most visited, but it is precise enough to understand how neighborhoods move.
Location intelligence is the process of using location data to derive meaningful insight to solve a particular problem. It is possible to layer the location data on a map to identify relationships between different sets of geospatial data. For example, retailers combine their transactional data with their indoor positioning data to understand the how many people enter each store, what they buy, where they live, and their demographics.
This understanding is limited to the entrance of the store. To help retailers go beyond indoor positioning systems, some location data providers derive insights and analytics from their sampled movement outside of a location.
Unfortunately, only studying a single technology sample leaves the sample prone to bias. Sampling bias occurs when a sample is collected in such a way that some members of the intended population are less likely to be included than others.
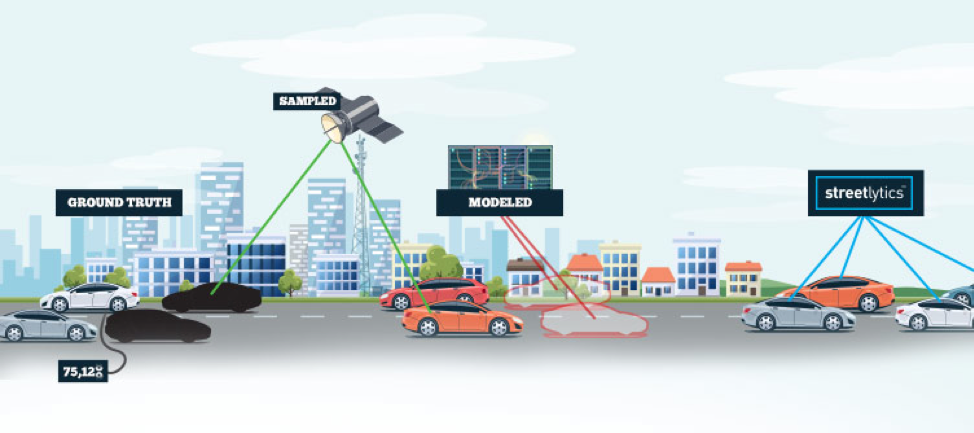
Understanding total population movement is possible using movement data from related but different sources. Citilabs’ Streetlytics uses a combination of phone movement data, traffic counts and travel demand modeling used in 2,500 cities around the world. The millions of observations from all three of these complementary data sources are input into a complex mathematical process to create the most complete, accurate and consistent national mobility data set ever created. This combination allows Streetlytics to confidently measure the average total population movement on all US roads every month.
It is necessary to match the best location intelligence to its specific use case. If the intended use is understanding movements within a specific store, indoor positioning systems are best. If the intended use is advertising to people who are in a specific store, general app location data is best. If the intended use is understanding the changes in mobility, urban development, out of home advertising, auto risk or anything else with the total population, then Streetlytics is the best.
Citilabs
Citilabs has built the world’s leading transportation modeling and simulation software, Cube, used in 2,500 cities around the world. In 2017, Citilabs combined its understanding of transportation simulation with mobile phone data and traffic counts to create Streetlytics. Streetlytics is the measurement of hourly vehicle and pedestrian volumes, speeds and demographics on every segment of road in the US. Streetlytics also includes the origin destination pairs for every vehicular trip and the turn by turn path in-between. Since 2017, Streetlytics has become the data that powers audience location measurement for Geopath, the nonprofit auditing organization for the US out-of-home media industry.
The $8B American billboard industry relies on understanding the total audience exposed to each of their billboards. This is a specific need which requires a specific type of location data. Location data on the movement of people can be gathered using four different technologies. Data from each of these technologies is aggregated and anonymized to protect the public’s privacy.
Fully autonomous vehicles (SAE Level 5 AVs) have the potential to disrupt city, region, and state transportation and land use plans. Citilabs recommends for all models that predict transportation beyond 2030 to include AVs. Including AVs in regional models will enable the simulation of multiple scenarios of AV adoption. This blog discusses potential changes caused by AVs and provides tips on how to incorporate possible changes into existing models.
Traffic counts are useless if they are old or not directly in front of the specified location. Streetlytics provides average annual and seasonal daily vehicular and pedestrian traffic for every address in the US, Puerto Rico, Vancouver and Toronto (All of Canada available in 2019). This is updated every month with hourly weekday, Friday, Saturday, and Sunday counts. These counts are directional and show how many people turn right and turn left at every intersection.
99 pages of applications, thousands of pages of supporting documents, $10,861 in fees and a lawyer, 9 days off work for appointments, 1,824 days later, and counting ... my wife is still not a permanent resident nor a citizen of the United States.
If MARTA truly wants to stick to its stated vision of providing public transit to boost economic development and enhance the lives of Atlantans, they should use our money to install light rail around the entire BeltLine loop and it should be done now!
This blog is about the devices and their connections that I have experimented with for home efficiency and security.
Citilabs’ Streetlytics combines transportation demand modeling with cellular and app GPS measurement to understand volume, speed, home locations, origins and destinations for every section of the road for every hour of the day.
Who was affected by the 85 bridge collapse
I mapped as many approved and proposed projects as I could find for the city of Atlanta.